
Sales / Bill Performance v2
What is Sales / Bill Performance?
The Sales / Bill Performance report allows you to check and compare sales for your outlets.
You can use this report to:
- View total sales for a year.
- View daily sales for a selected month.
- Compare sales between outlets.
- Check Coin and E-Payment sales.
- View monthly sales for a selected outlet.
- Identify outlets with the highest sales.

1. Select Your Filters
Before viewing the report, select the filters you need.
Step 1: Select Outlet
Select the outlet you want to check.
If you want to view sales for all outlets, leave the Outlet filter unchanged.
Step 2: Select Year
Select the year you want to view.
Example: 2026
Step 3: Select Month
Select the month you want to view.
The selected month is mainly used when viewing the Daily Sales report.
Example: September
Step 4: Select Outlet Group
If you have already created an Outlet Group, you can select it here.
Once an Outlet Group is selected, the system will automatically apply the outlets included in that group.
Tip: Use Outlet Group when you regularly check the same group of outlets.
Reports
2. Annual Sales
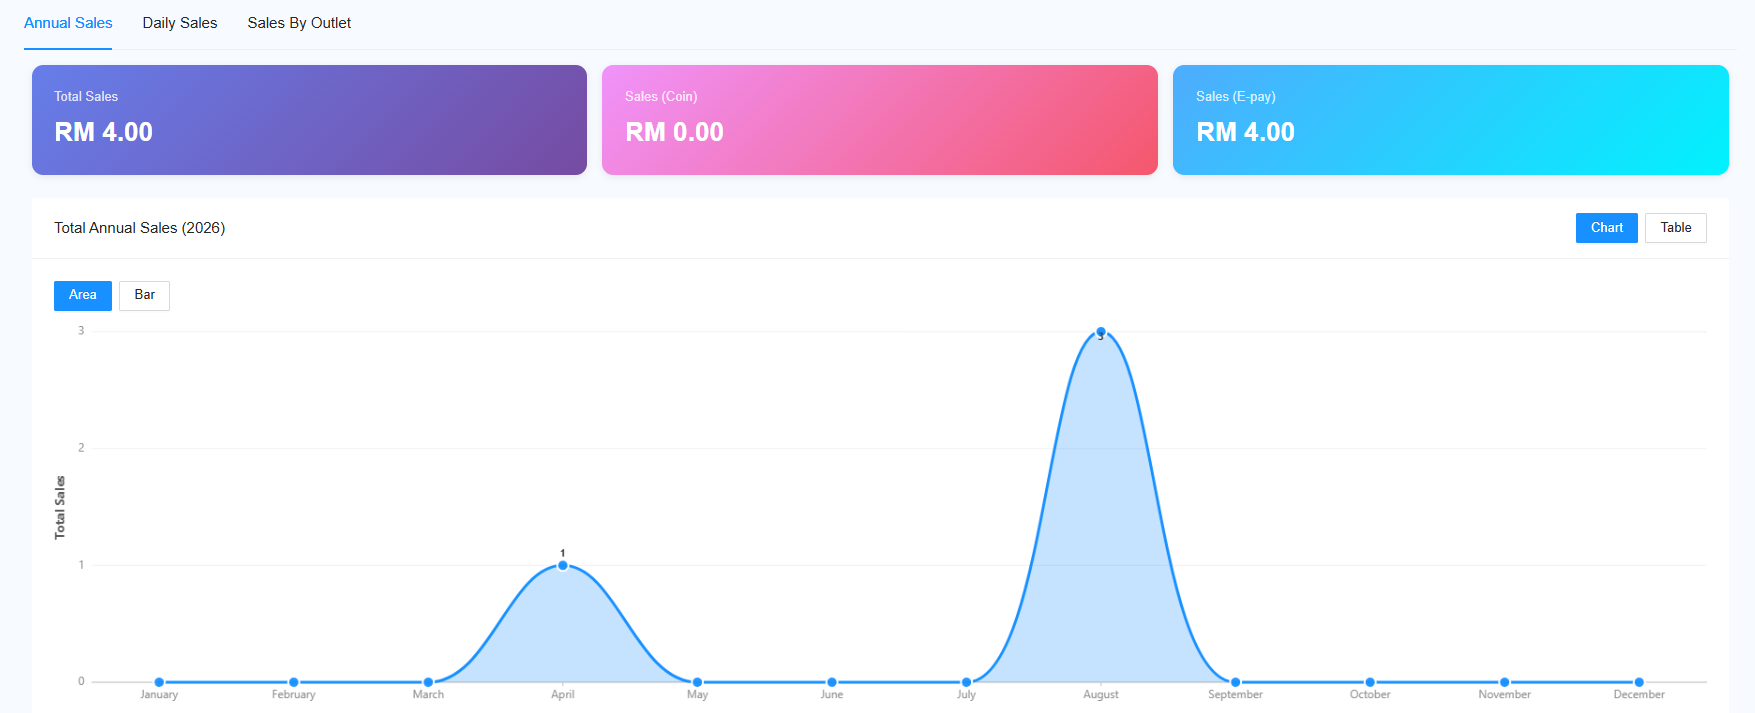
The Annual Sales section shows the sales performance for the selected year.
You can view:
- Total Sales – Total sales for the selected year.
- Coin Sales – Sales collected through coins.
- E-Payment Sales – Sales collected through electronic payments.
How to view Annual Sales
- Select the Year.
- Select the Outlet or Outlet Group, if required.
- View the Annual Sales report.
You can view the information in:
- Graph Format – For an easy visual comparison.
- Table Format – For detailed figures.
3. Daily Sales
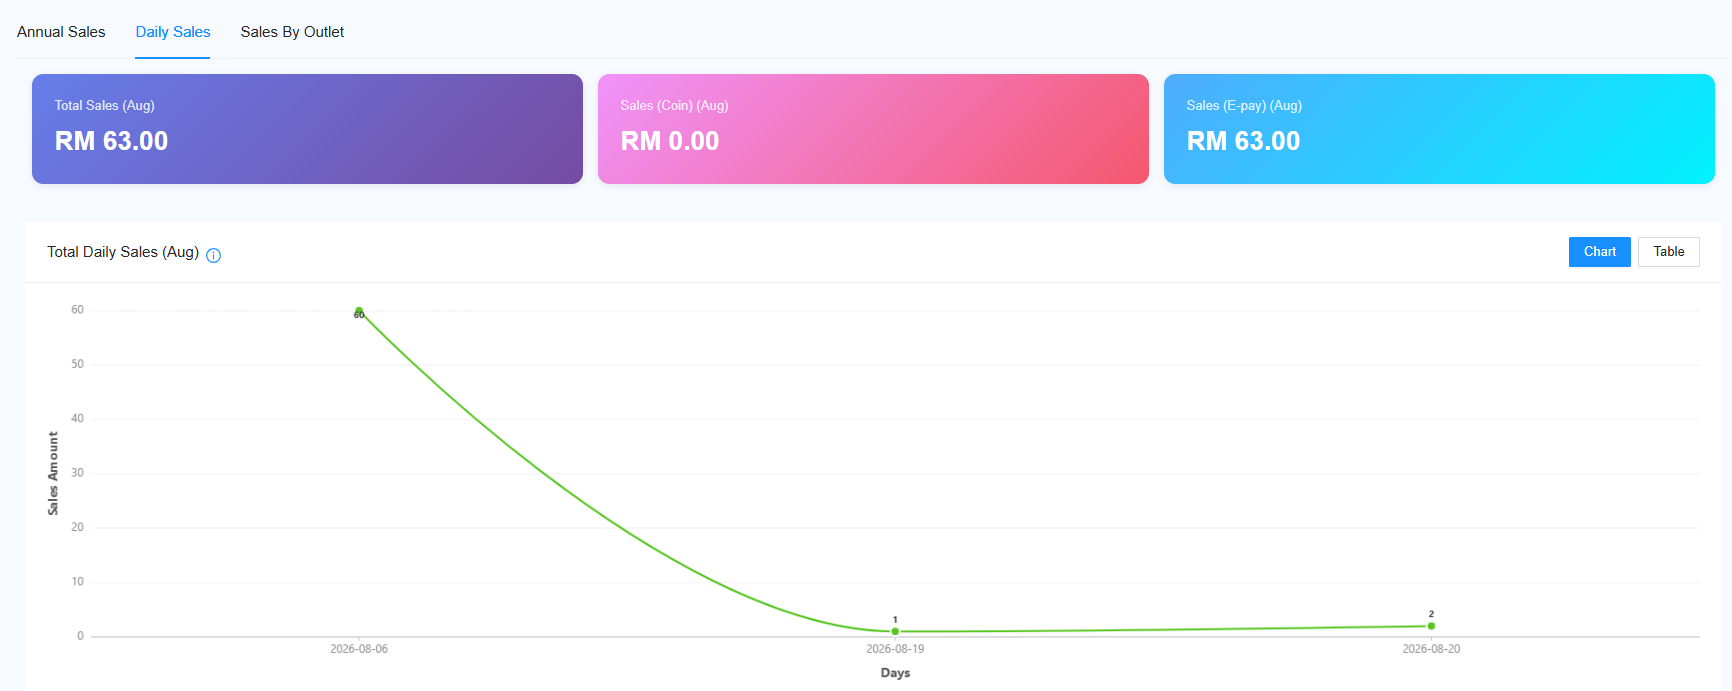
The Daily Sales section shows the sales for each day within the selected month.
You can view:
- Daily Total Sales
- Daily Coin Sales
- Daily E-Payment Sales
How to view Daily Sales
- Select the Year.
- Select the Month.
- Select the Outlet or Outlet Group, if required.
- View the Daily Sales report.
The information is available in:
Graph Format
Use the graph to quickly compare sales between days.
Table Format
Use the table when you need to check the exact sales amount for each day.
Sales by Outlet
4. Sales by Outlet
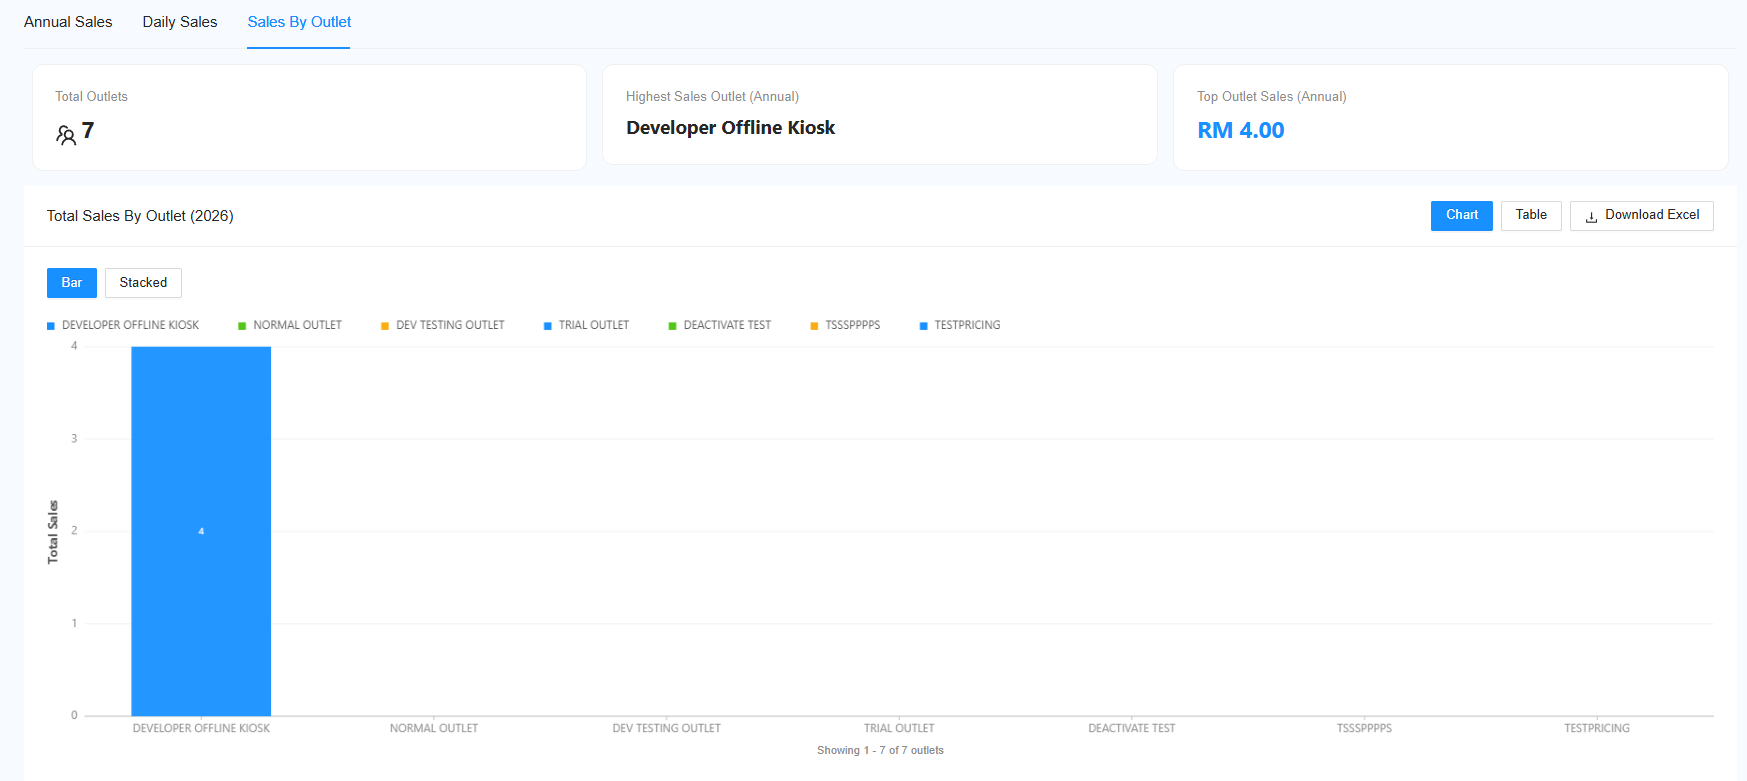
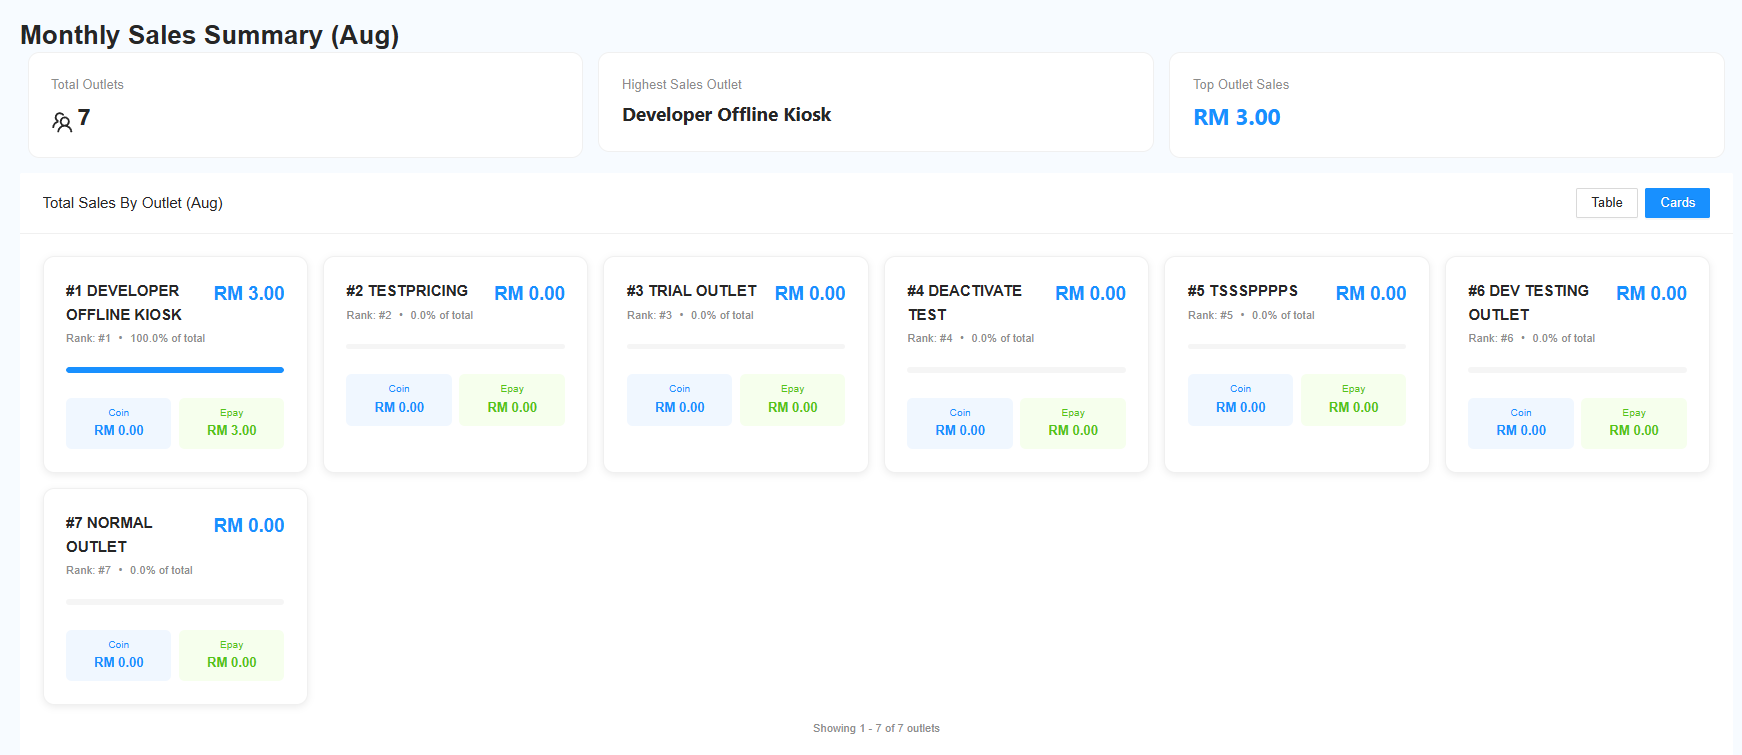
The Sales by Outlet section allows you to compare sales between different outlets.
Overall Statistics
The report provides an overview of your outlets, including:
- Total Outlets – Number of outlets included in the report.
- Highest Sales Outlet – Outlet with the highest sales.
- Highest Sales Amount – Sales amount recorded by the highest-sales outlet.
- Total Sales – Combined sales from the selected outlets.
Sales for Each Outlet
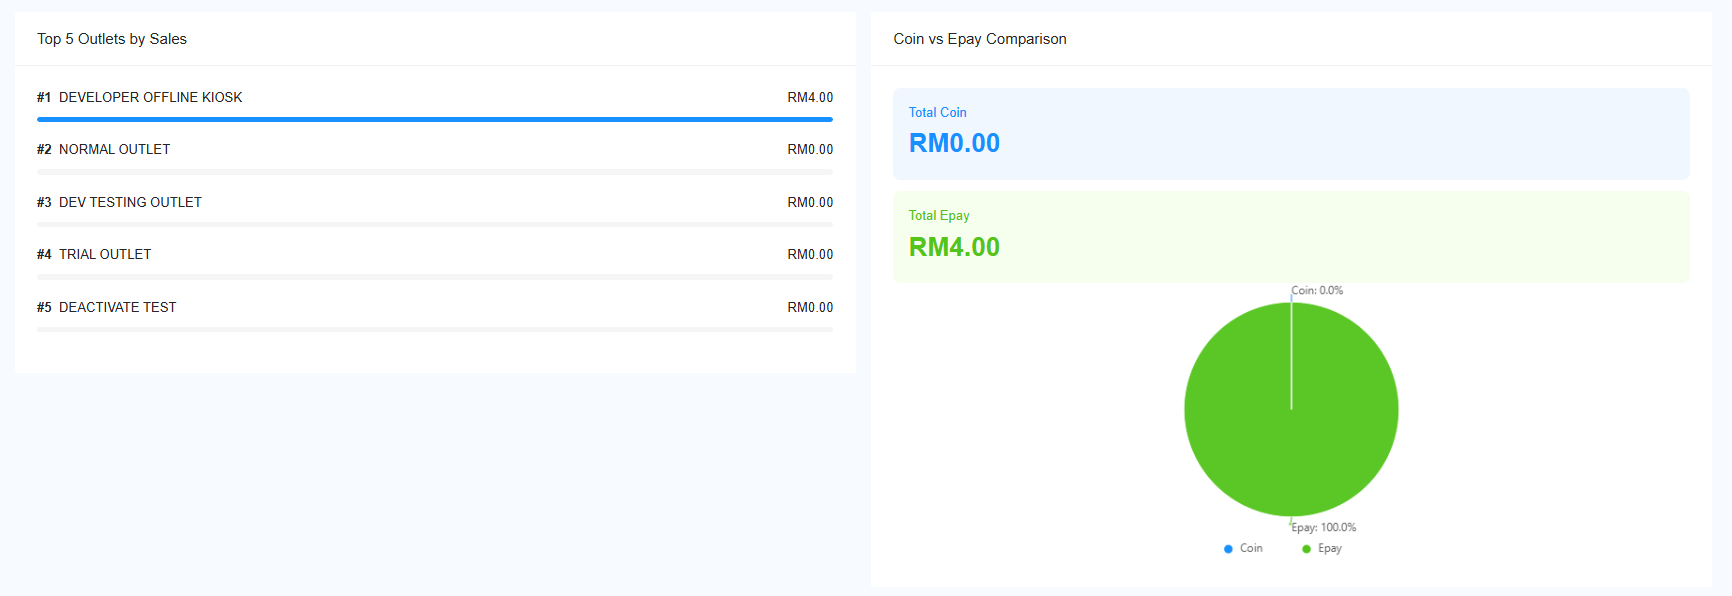
You can view the sales amount for each outlet.
The report allows you to check:
- Total sales for the selected year.
- Monthly sales breakdown.
This makes it easier to compare sales between different outlets.
5. Top Outlets
The Top Outlets section allows you to view the outlets with the highest sales.
You can choose to view:
- Top 5 Outlets
- Top 10 Outlets
The results are based on the selected Year and Month.
Example: If you select September 2026, the Top Outlets list will be based on the sales data for the selected period.
6. Selected Outlet Monthly Sales
Use this section when you want to check the monthly sales of one specific outlet.
The report shows:
- Total Monthly Sales
- Coin Sales
- E-Payment Sales
Sales Breakdown
The monthly sales are divided into:
Coin
Sales collected through coins.
E-Payment
Sales collected through electronic payments.
Total Sales
Combined Coin and E-Payment sales.
This allows you to compare the outlet's sales performance from month to month.
Quick Guide
| Report | What can you check? |
|---|---|
| Annual Sales | Total yearly sales |
| Daily Sales | Sales for each day |
| Sales by Outlet | Compare sales between outlets |
| Top Outlets | Outlets with the highest sales |
| Selected Outlet Monthly Sales | Monthly sales for one outlet |
Example
If you want to check daily sales for September 2026:
Select Year: 2026
Select Month: September
Select Outlet: Your preferred outlet
View: Daily Sales
You can then compare:
Coin Sales + E-Payment Sales = Total Sales
Quick Steps
Select Outlet → Select Year → Select Month → Select Outlet Group (if needed) → View the Report
No comments to display
No comments to display