
Sales / Bill Performance v2

1. Filter
The dashboard should provide the following filters:
-
Select Outlet
- Select an outlet to view.
- Ignore this filter to include all outlets.
-
Select Year
- Select the year for the report.
-
Select Month
- Select the month for the report.
-
Select Outlet Group
- Select an outlet group for quick/favourite searches.
- The selected group will automatically apply the corresponding outlets.
Reports
2. Annual Sales Data
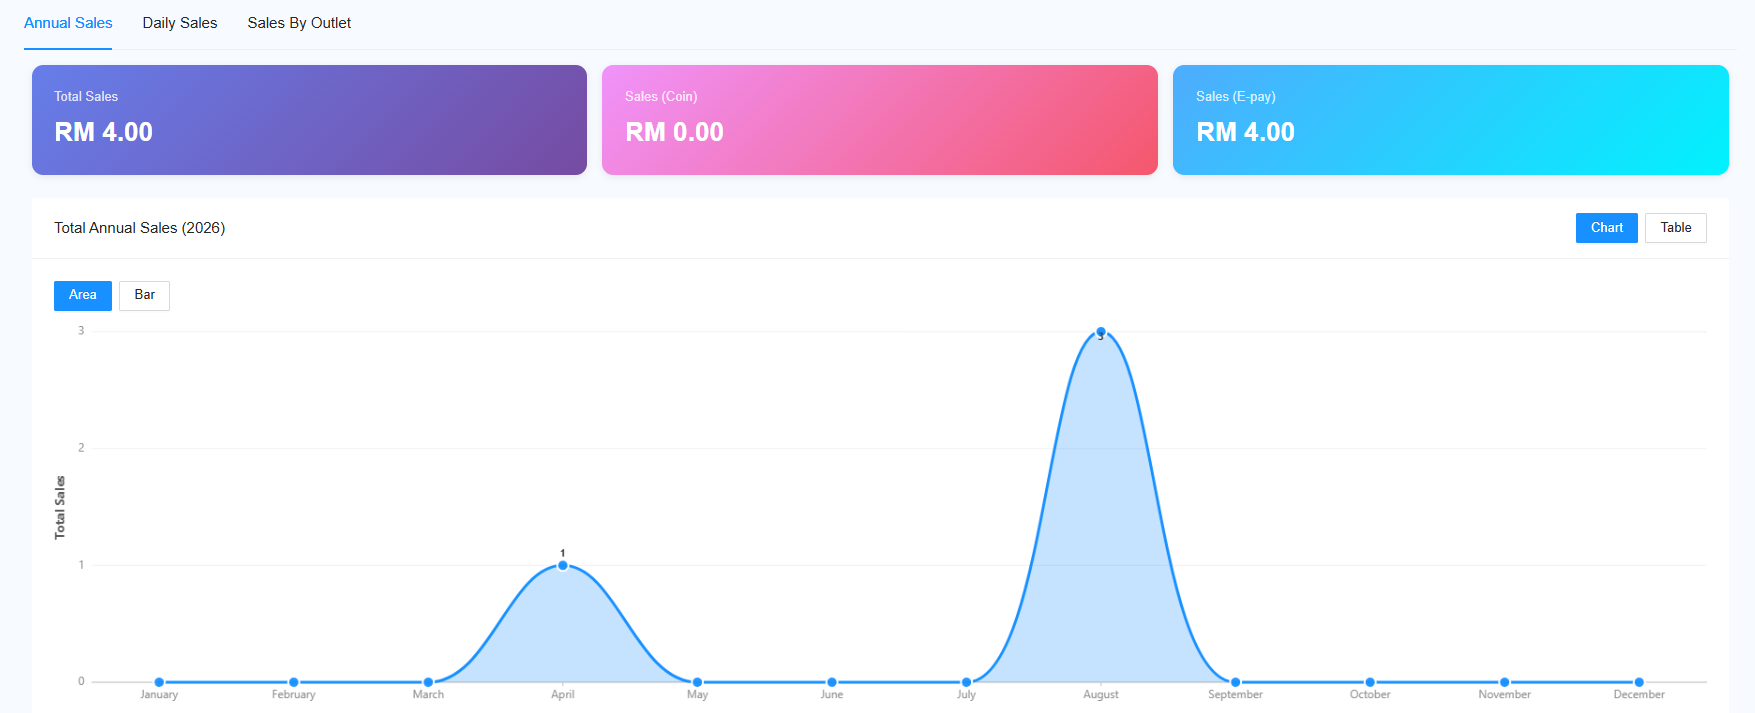
Display the sales data for the selected year.
The report should show:
- Total Sales
- Coin Sales
- E-Payment Sales
Data Visualization
Users can switch between two different graph types to visualize the annual sales data.
The report should also be available in Table Format for viewing the detailed yearly data.
3. Daily Sales
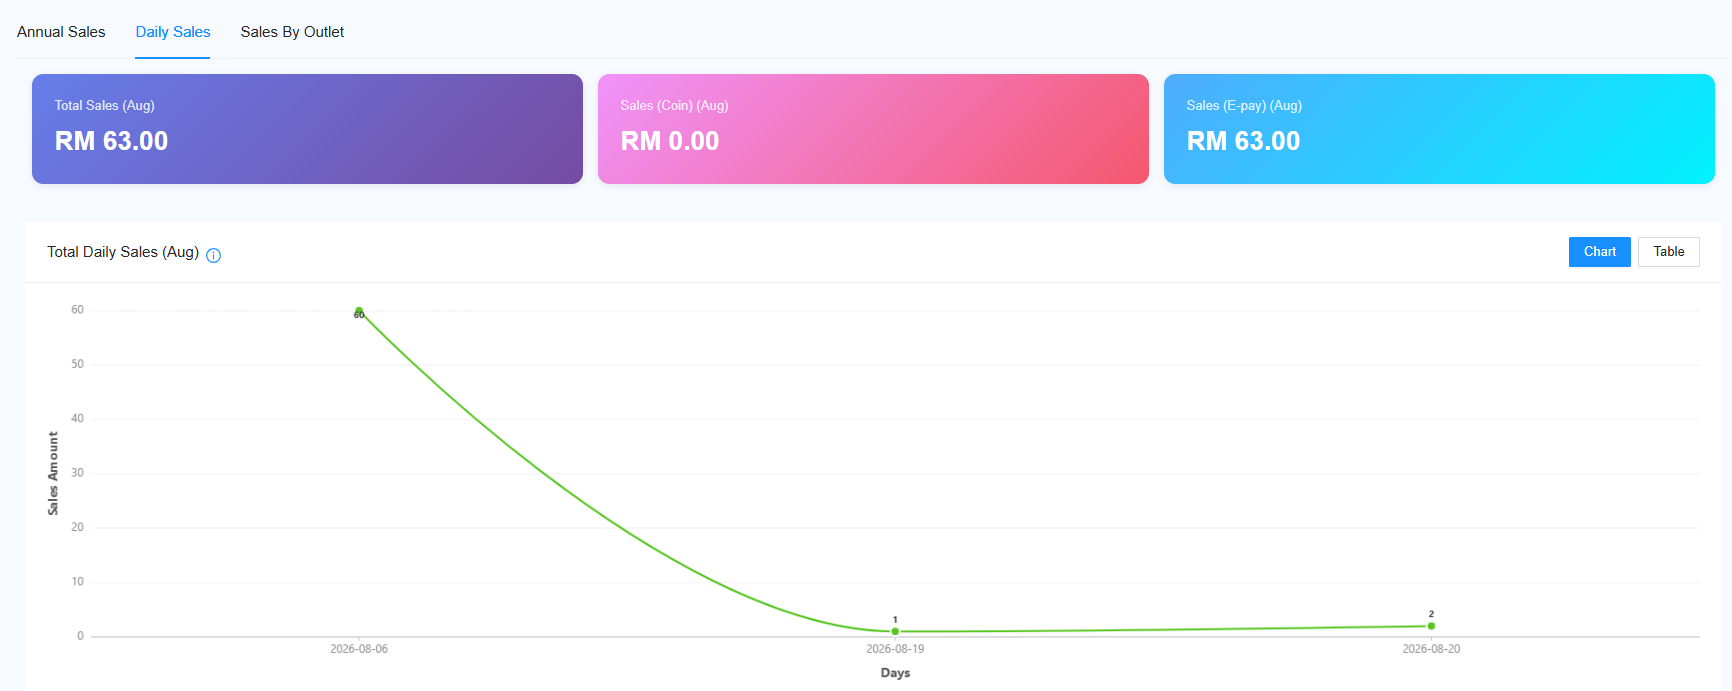
Display the daily sales data for the selected month.
The report should show:
- Daily Total Sales
- Daily Coin Sales
- Daily E-Payment Sales
The data should be available in:
- Graph Format
- Table Format
Sales by Outlet
4. Outlet Sales Overview
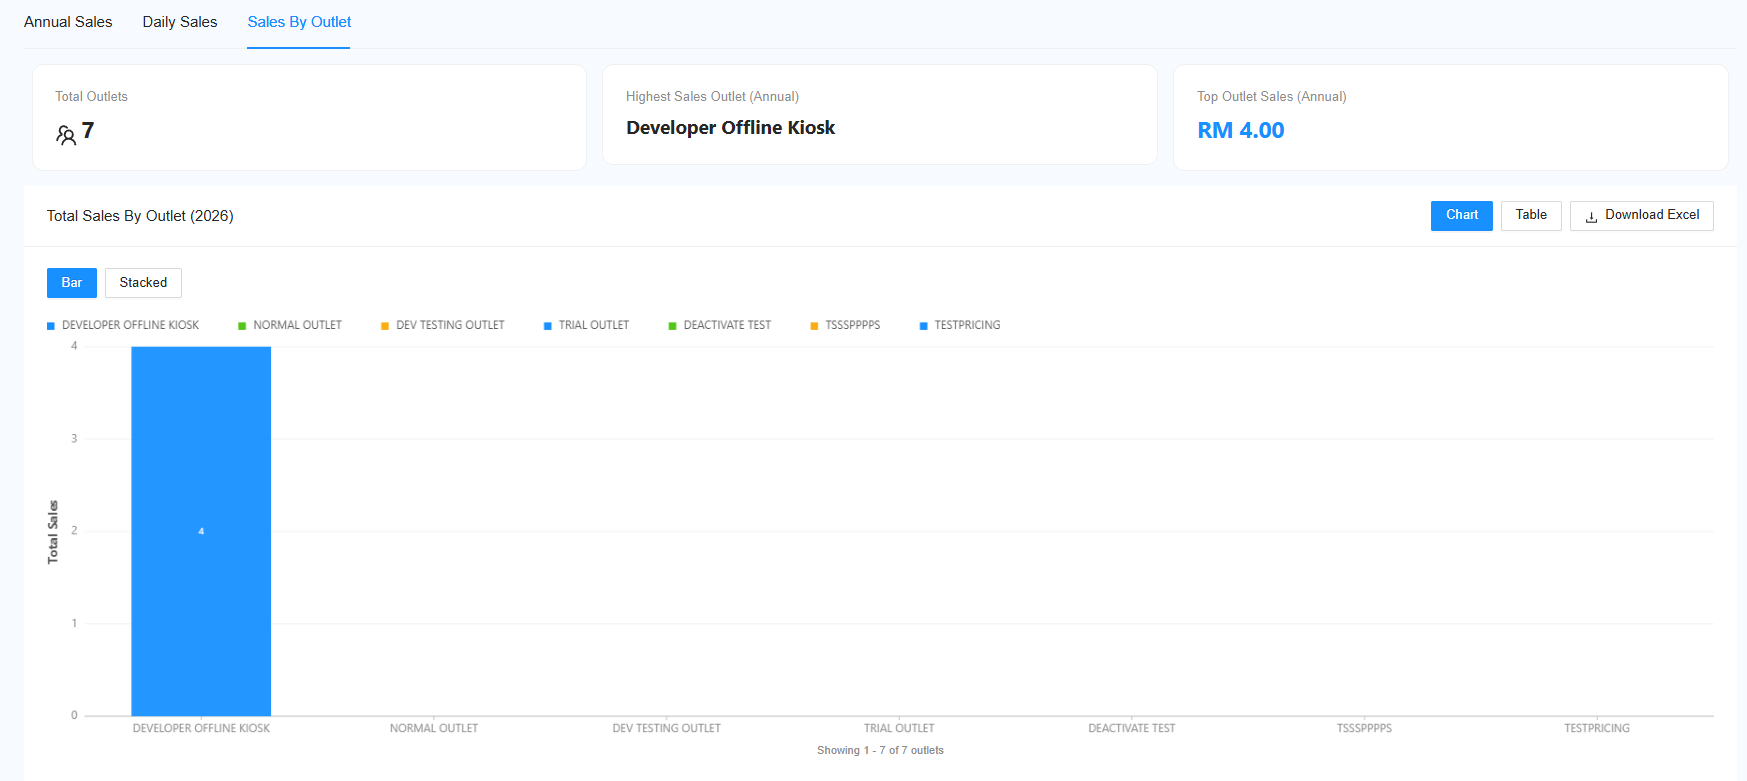
Provide an overview of sales performance across all outlets.
Overall Statistics
Display:
- Total Outlet
- Highest Sales Outlet
- Highest Sales Amount
- Total Sales
Sales by Outlet
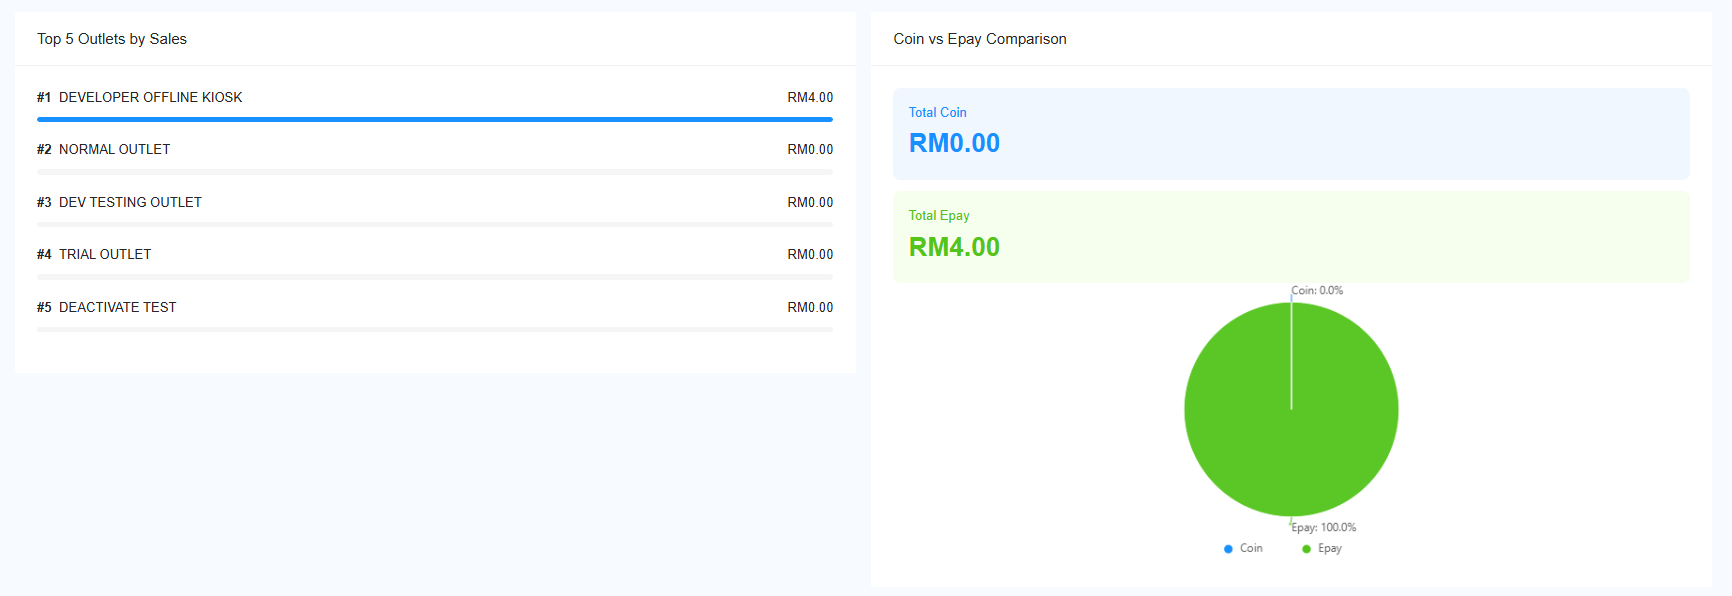
Display the total sales for each outlet.
The report should support viewing:
- Total sales for the selected year
- Monthly sales breakdown
Top Outlets
Display the highest-performing outlets based on sales.
Support:
- Top 5 Outlets
- Top 10 Outlets
The ranking should be based on the selected:
- Year
- Month
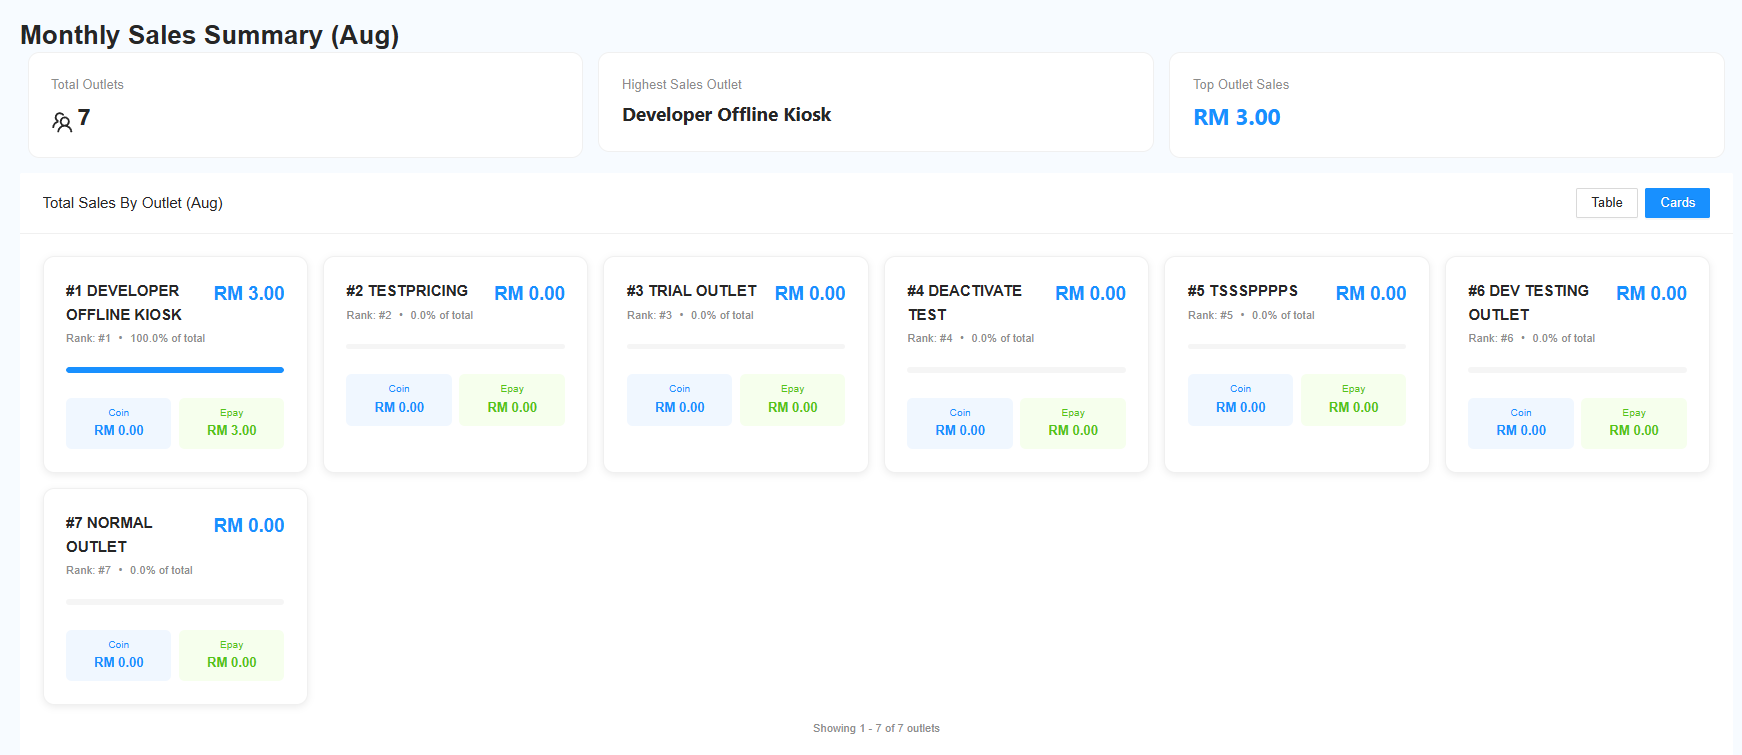
5. Selected Outlet Monthly Sales
Display the monthly sales summary for a selected outlet.
The report should show:
- Total Monthly Sales
- Coin Sales
- E-Payment Sales
Sales Breakdown
The monthly sales should be broken down into:
- Coin
- E-Payment
- Total Sales
This allows users to compare the outlet's sales performance and payment method breakdown over the selected period.