
Offline Dashboard
Offline Dashboard
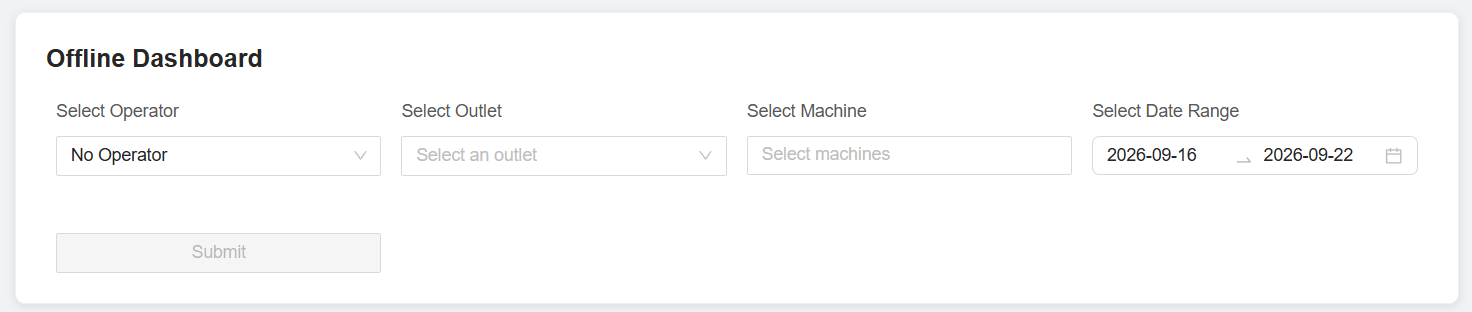
1. Filter
The dashboard should provide the following filters:
-
Select Operator
- Select the operator to view.
-
Select Outlet
- Select the outlet to view.
-
Select Machine
- Select a specific machine.
- Ignore this filter if all machines need to be included.
-
Select Date Range
- Select the date range for the dashboard data.
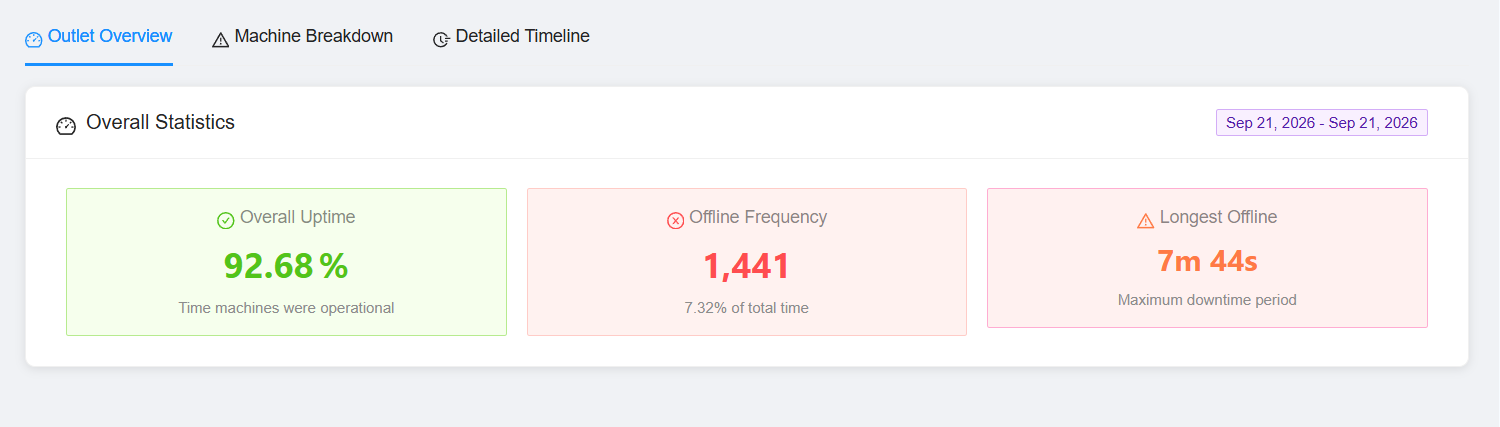
2. Outlet Overview
Provides an overall summary of the outlet's online and offline status.
-
Display statistics for:
- Total online time
- Total offline time
- Overall uptime
-
Display:
- Overall Uptime – Percentage of time the outlet was online.
- Offline Frequency – Number of times the outlet went offline.
- Longest Offline Time – Longest continuous period the outlet was offline.
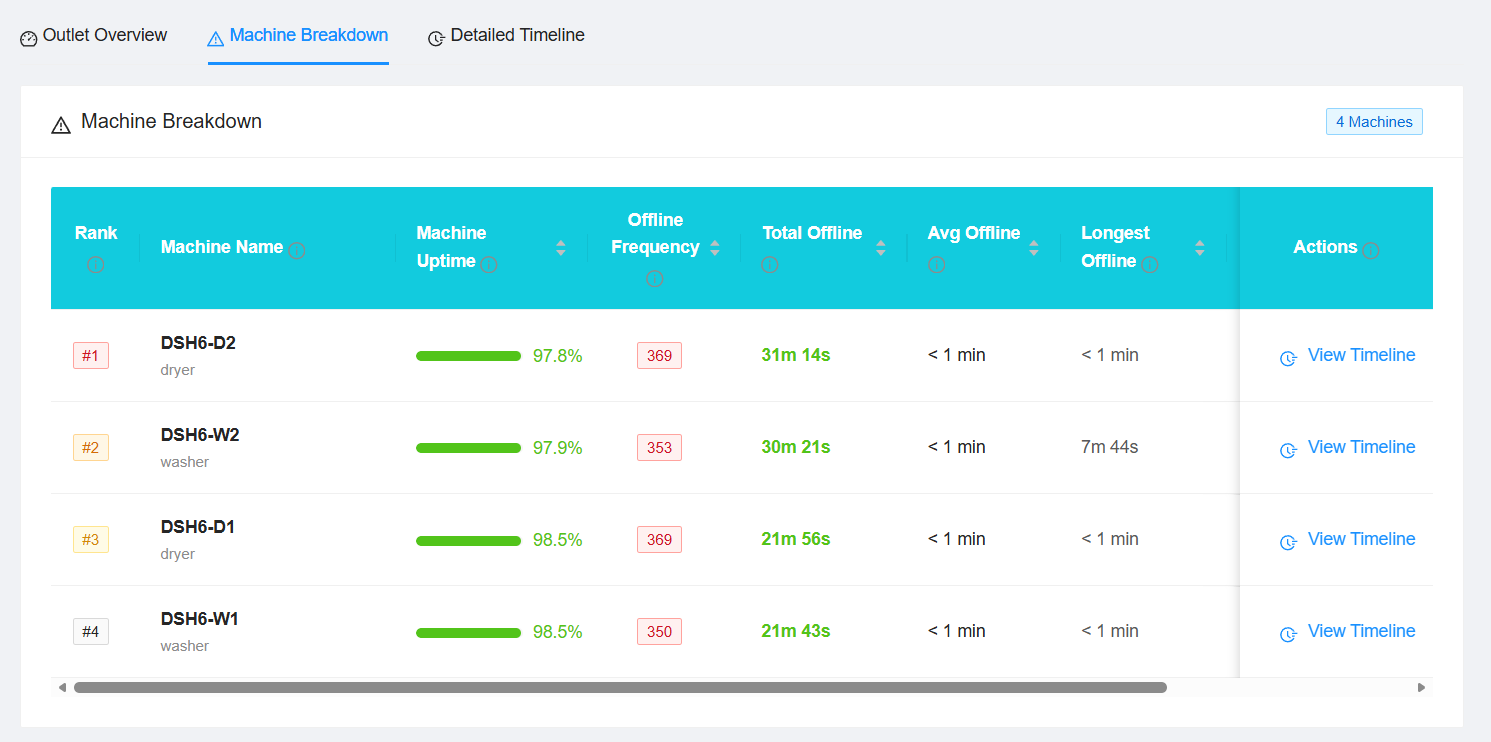
3. Machine Breakdown
Provides a breakdown of the online/offline status for each machine in the selected outlet.
For each machine, display:
- Machine Uptime
- Offline Frequency
- Average Offline Duration
- Longest Offline Duration
Machine Details
Users can click Detailed for a specific machine to view a more detailed breakdown of its online/offline activity.
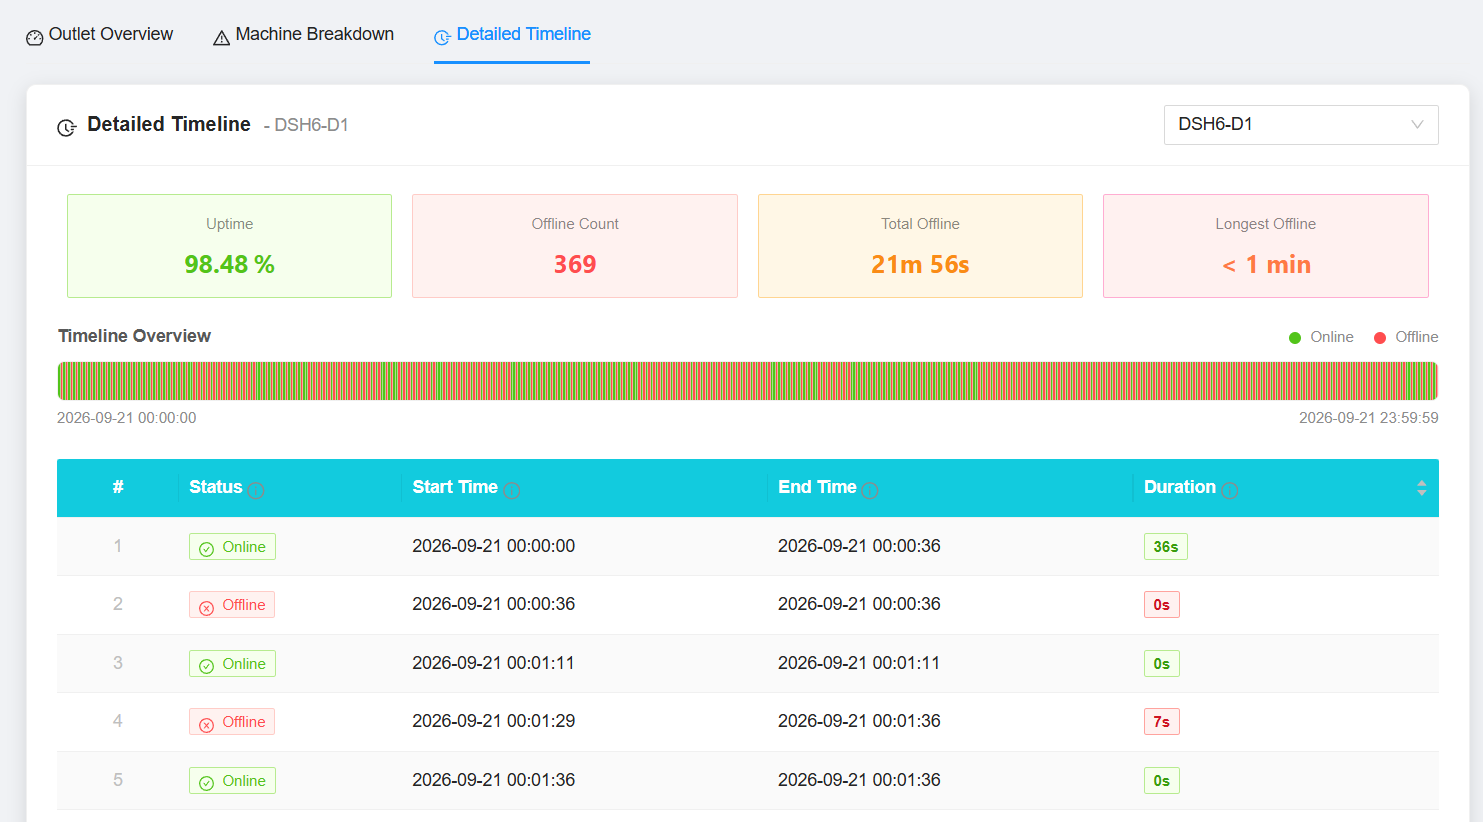
4. Detailed Timeline
Displays a detailed timeline of the machine's online and offline activity.
The timeline should show:
- When the machine went offline
- When the machine came back online
- Duration of each offline period
- Duration of each online period
- Total online/offline duration
- Any other relevant status information
This allows users to clearly understand the machine's availability and identify periods of downtime.