
Machine Utilization v2
What is Machine Utilization?
Machine Utilization allows you to check how frequently your machines are being used during a selected period.
You can use this report to compare machine usage by:
You can also view the results by hour, day, week, or month.
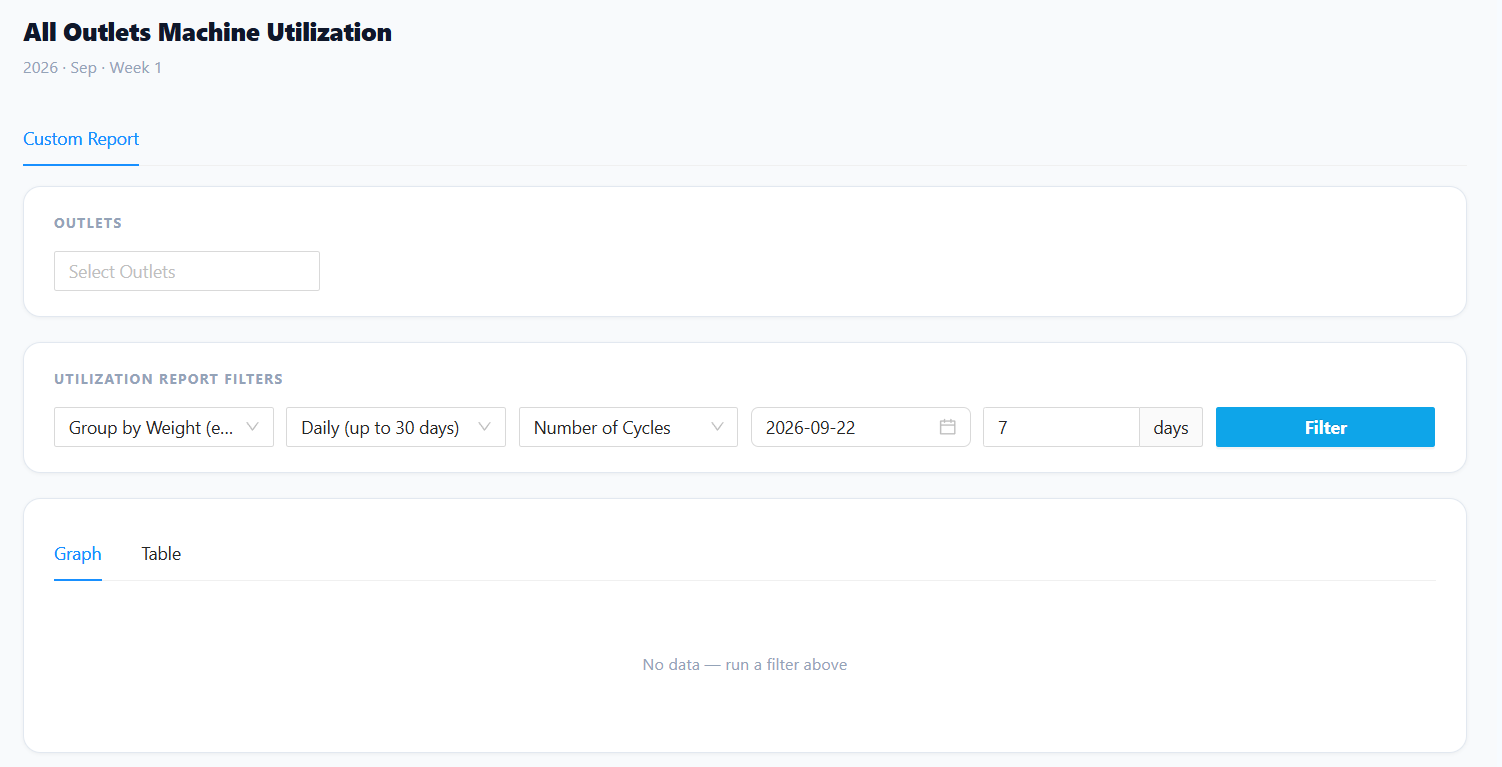
1. Filter
Select Your Filters
TheBefore dashboard should provideviewing the followingmachine filters:utilization data, select the filters you need.
Step
1:Select Outlet
Select anthe outlet you want to view.
If you want to view data from all outlets, leave this filter ifas dataAll.
Step outlets2: needs to be displayed.
Select Group Data
Choose how you want the machine utilization data shouldto be grouped:displayed.
You can select:
Weight Group
Groups machines according to their weight category.
Individual Machine
Shows the utilization of each machine separately.
Machine Type
Groups machines according to their type, such as Washer or Dryer.
Step 3: Select Time Period
Choose how you want the data to be grouped over time.
ByHourlyWeight–GroupView utilization by hour.IndividualDailyMachine– View utilization by day.MachineWeeklyType– View utilization by week.
Step
4:Select Time Period
Select Utilization Metric
Choose how you want to measure machine utilizationusage.
Number of Cycles
Shows how many cycles the machine completed.
Time Utilization
Shows how much time the machine
was being used.
Step 5: Select Date
Select the required date or date range.
Depending on the selected time period, you may also be able to select specific days when applicable.
days.
2. View the Utilization Data
TheAfter selecting your filters, the system will display the machine utilization datadata.
You becan displayed based onview the selectedresults filtersin andtwo grouping.formats:
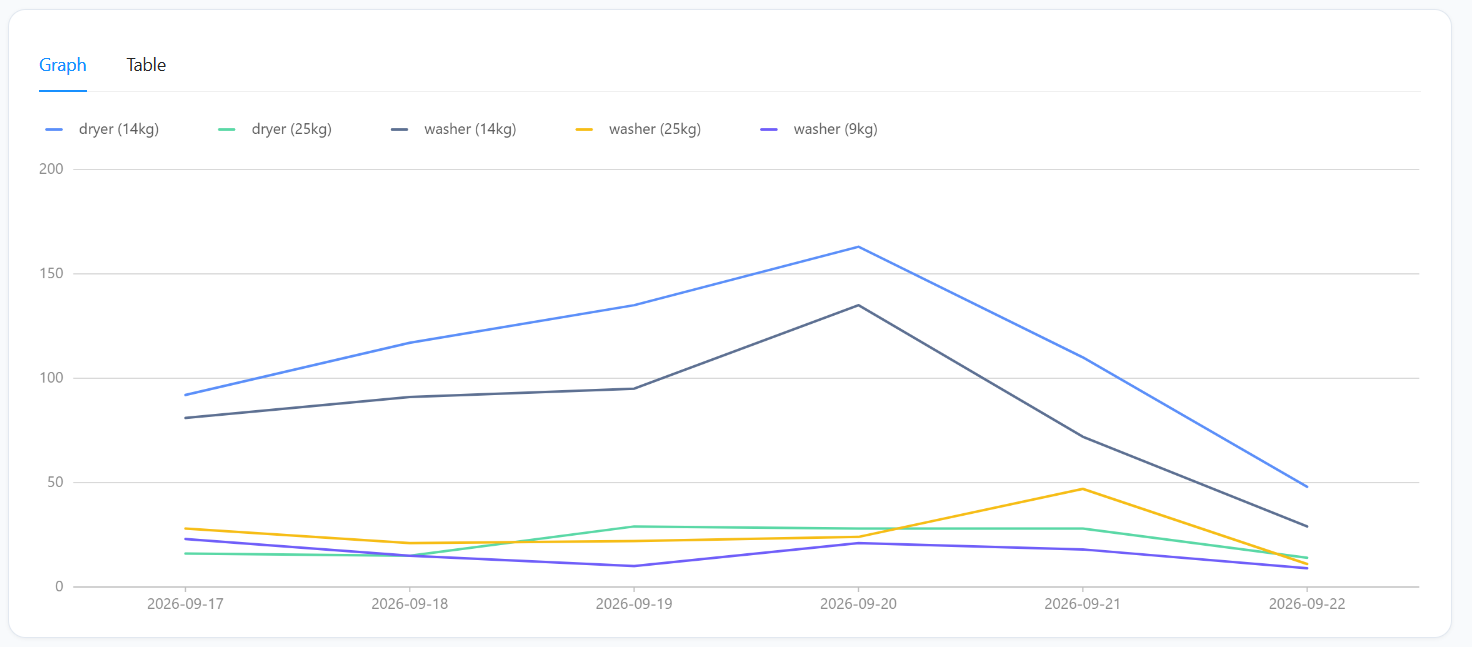
Graph
The dataGraph cangives beyou displayeda inquick either:visual overview of machine usage.
Use the graph to easily compare:
GraphDifferentFormatmachinesTableMachineFormat
Graph Format
The graph should visualize machine utilization based on the selected:
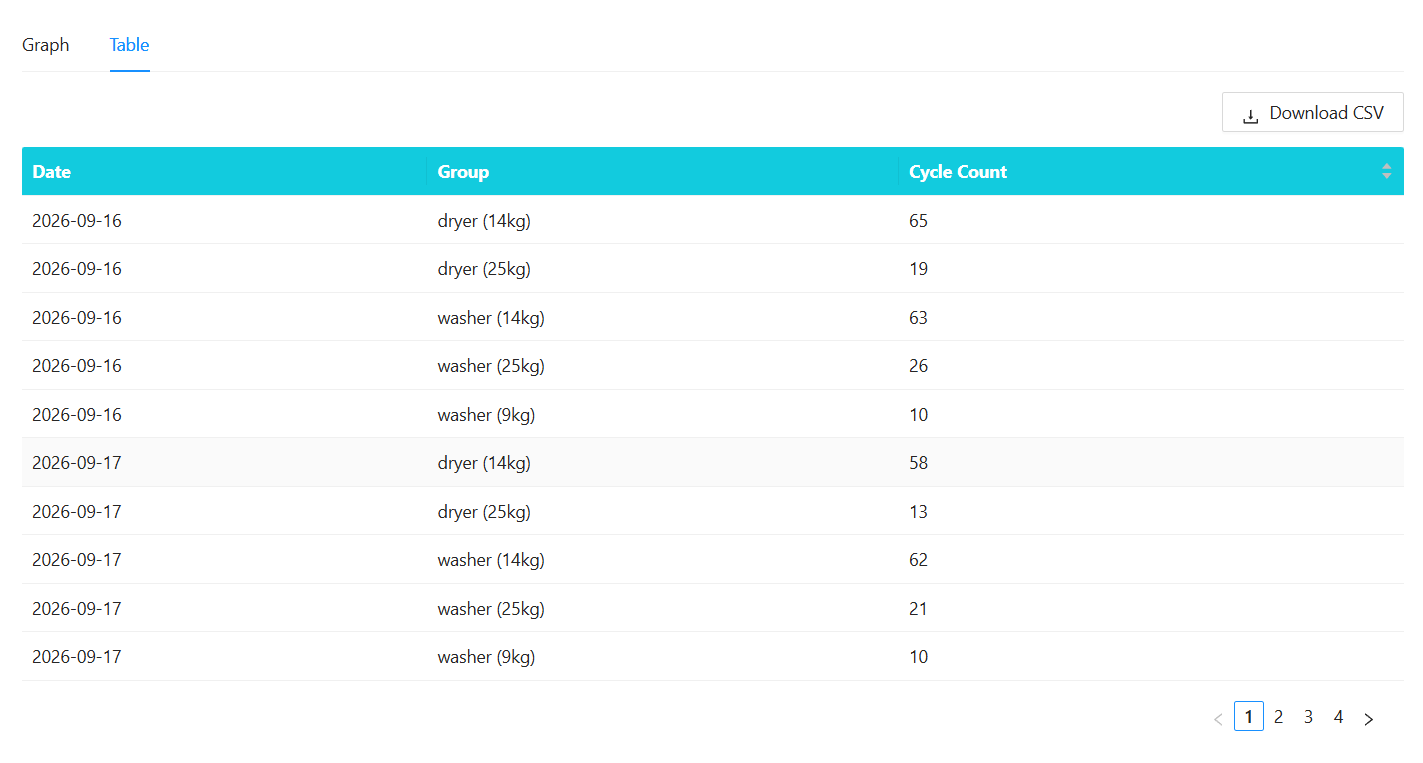
Table Format
The tableTable should displayprovides the correspondingdetailed utilization datadata.
Use detailthe basedtable onwhen you need to check the exact figures for a machine, group, or selected period.
3. Example
For example, if you want to check how many times your dryers were used each day:
Outlet: Outlet A
Group Data: Machine Type
Time Period: Daily
Utilization Metric: Number of Cycles
Date: 1 September – 7 September
The report will show the number of dryer cycles for each day during the selected filtersdate and grouping.range.
4. Quick Guide
Quick Steps
Select Outlet → Select Group Data → Select Time Period → Select Utilization Metric → Select Date → View Graph or Table