
Machine Utilization v2
1. Filter
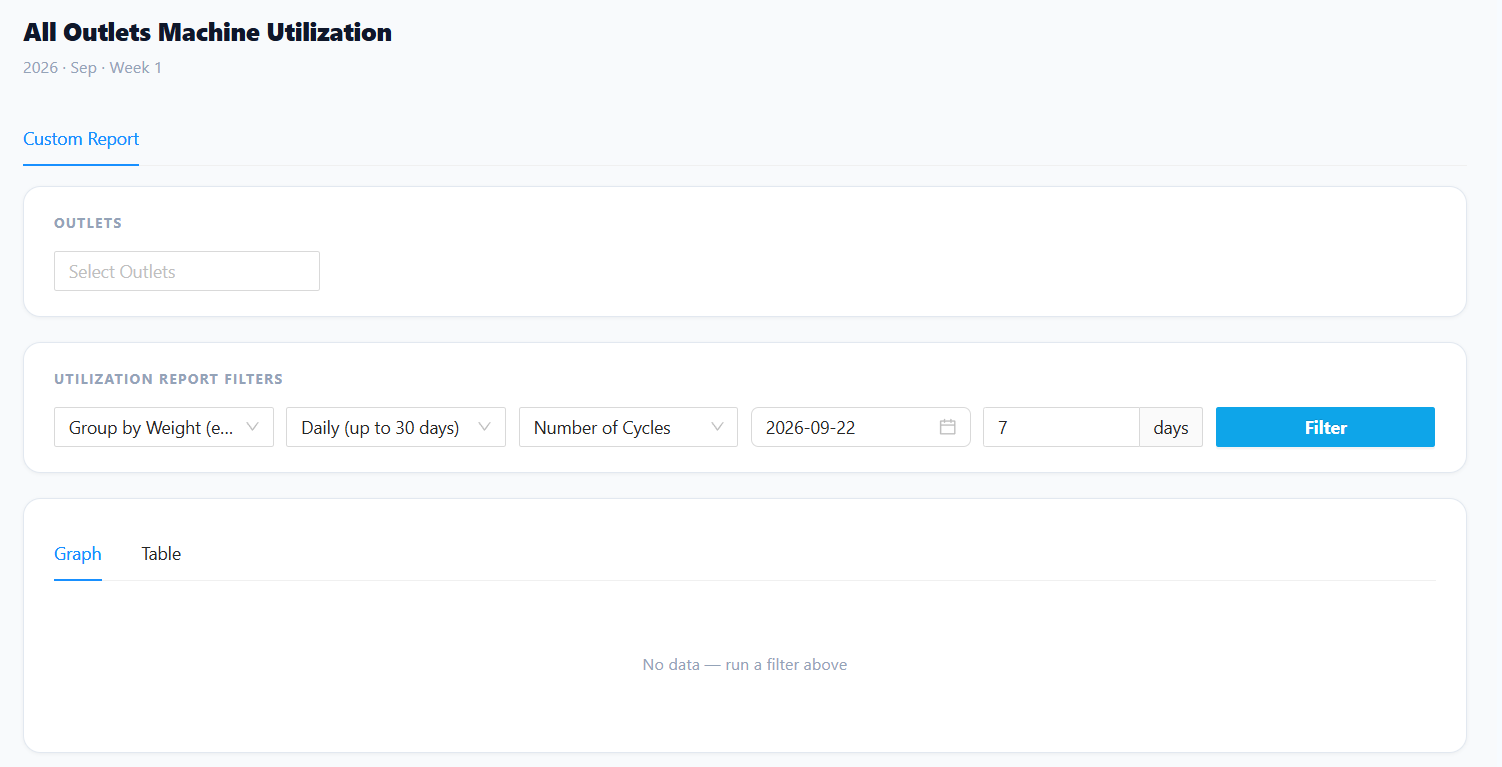
The dashboard should provide the following filters:
-
Select Outlet
- Select an outlet to view.
- Ignore this filter if data from all outlets needs to be displayed.
-
Select Group Data
- Select how the machine utilization data should be grouped:
- By Weight Group
- Individual Machine
- Machine Type
- Select how the machine utilization data should be grouped:
-
Select Time Period
- Select the data interval:
- Hourly
- Daily
- Weekly
- Monthly
- Select the data interval:
-
Select Utilization Metric
- Select how machine utilization should be measured:
- Number of Cycles
- Time Utilization
- Select how machine utilization should be measured:
-
Select Date / Days
- Select the required date or date range.
- Select specific days when applicable.
2. Utilization Data
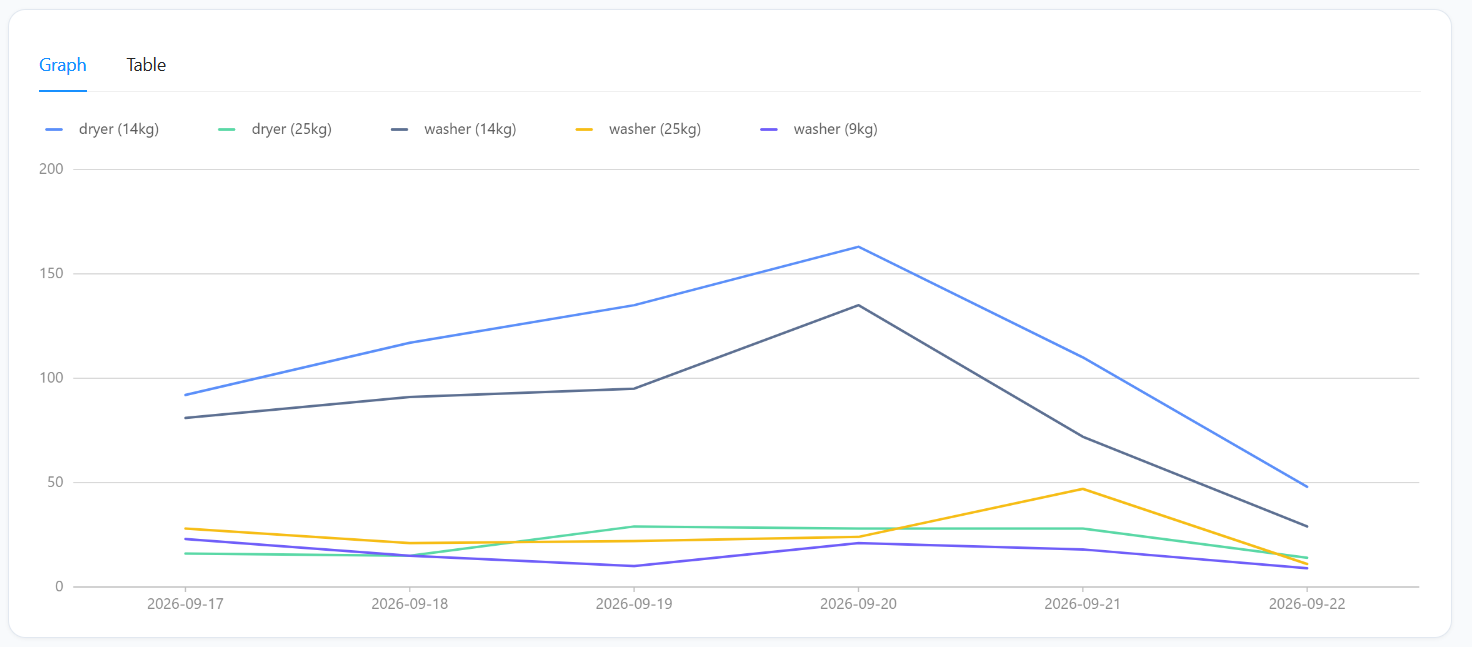
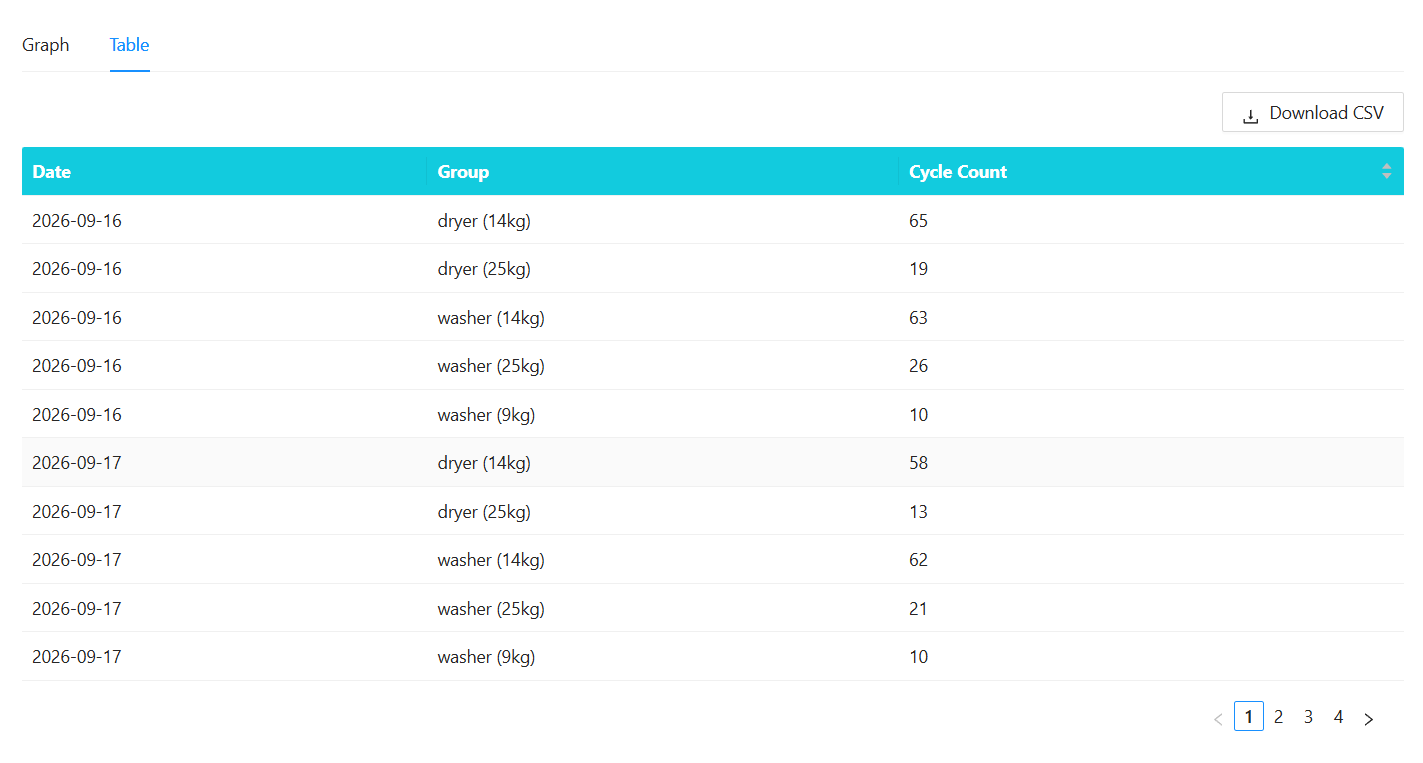
The machine utilization data should be displayed based on the selected filters and grouping.
The data can be displayed in either:
- Graph Format
- Table Format
Graph Format
The graph should visualize machine utilization based on the selected:
- Outlet
- Grouping
- Time period
- Utilization metric
- Date / days
Table Format
The table should display the corresponding utilization data in detail based on the selected filters and grouping.