
Coin Collection by outlet v2
🪙 Purpose
Use Coin Collection by Outlet v2 to view coin collection records by operator, outlet, and date.
You can view each outlet separately or combine multiple outlets into one report.
📍 How to Access
Step 1 — Open Laundro Portal
Log in to the Laundro Portal using your Username and Password.https://v2.thelaundro.com/operator_login
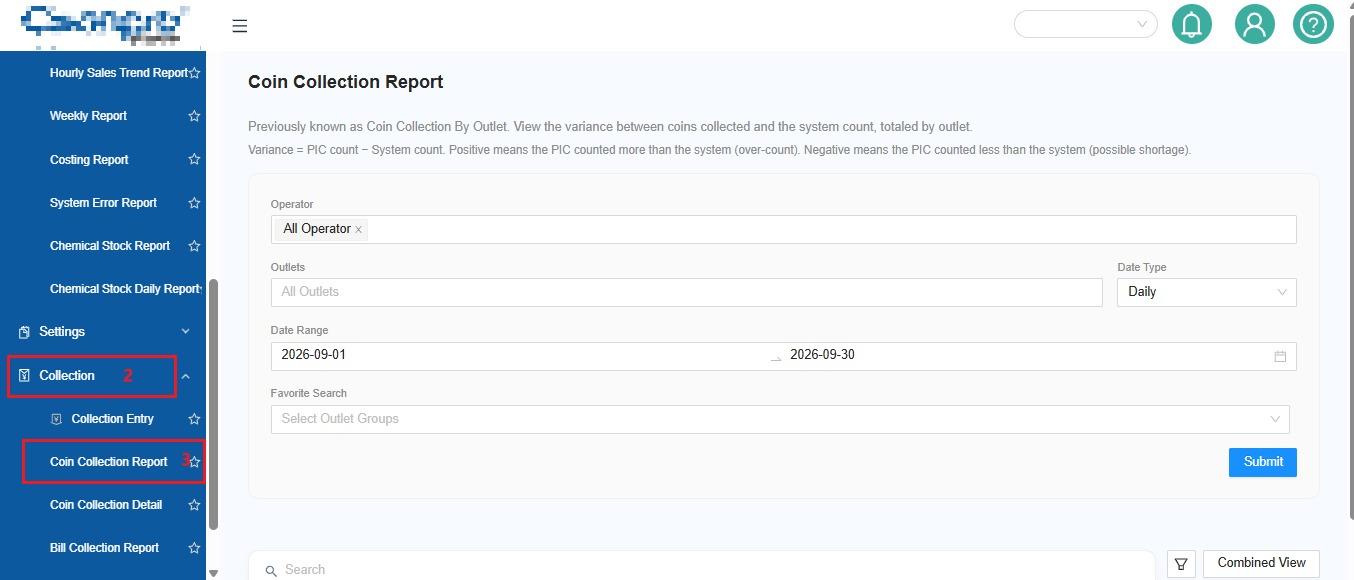
Step 2 — Open Collection
Step 3 — Select Coin Collection Report
Select Coin Collection Report from the Collection menu.
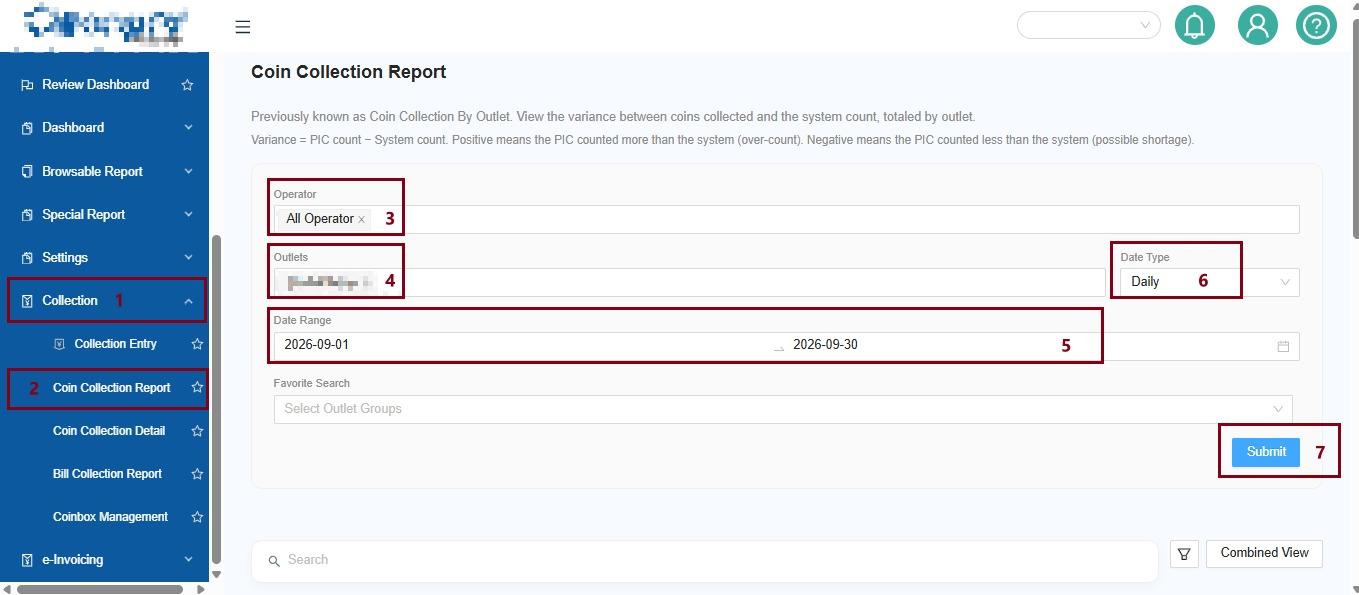
You will be directed to the Coin Collection Report page.
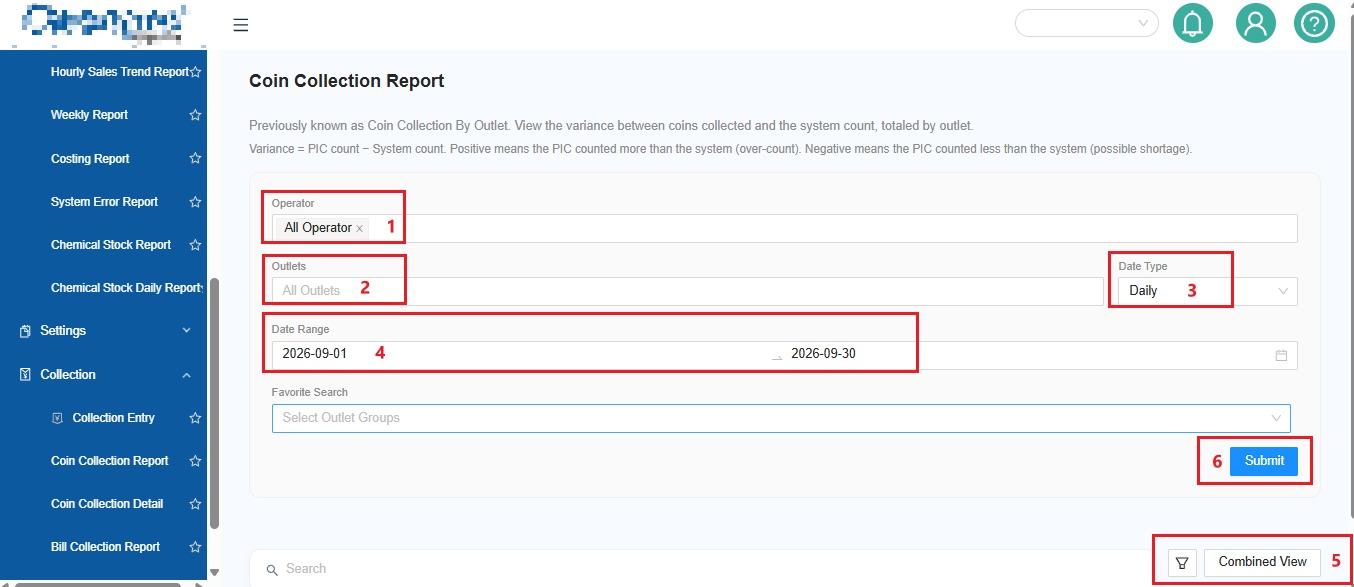
🔎 Step 1: Select Operator
Select the operator you want to check.
- Specific Operator → View one operator.
- All Operator → Include all operators.
🏪 Step 2: Select Outlet
Select the outlet you want to check.
- Specific Outlet → View one outlet.
- All Outlet → Include all outlets.
📅 Step 3: Select Date Type
Choose how you want the report to be displayed.
📆 Daily
View the collection by individual day.
Example: 1–30 September 2026
🗓️ Monthly
View the collection by month.
Example: January–September 2026
💡 Tip: After changing the Date Type, click Submit to refresh the report.
🗓️ Step 4: Select Date Range
Select the required date range based on the selected Date Type.
Daily: Select the required start and end date.
Monthly: Select the required months.
👀 Step 5: Select View Type
Choose how you want the report to be displayed.
🏪 By Outlet
View each selected outlet separately.
Outlet A → Report A
Outlet B → Report B
Outlet C → Report C
🔗 Combined View
Combine the selected outlets into one report.
Outlet A + Outlet B + Outlet C
↓
📊 One Combined Report
🤔 Which One Should I Use?
Need to check each outlet separately?
➡️ Choose By Outlet
Want to review multiple outlets together?
➡️ Choose Combined View
📊 Step 6: Generate the Report
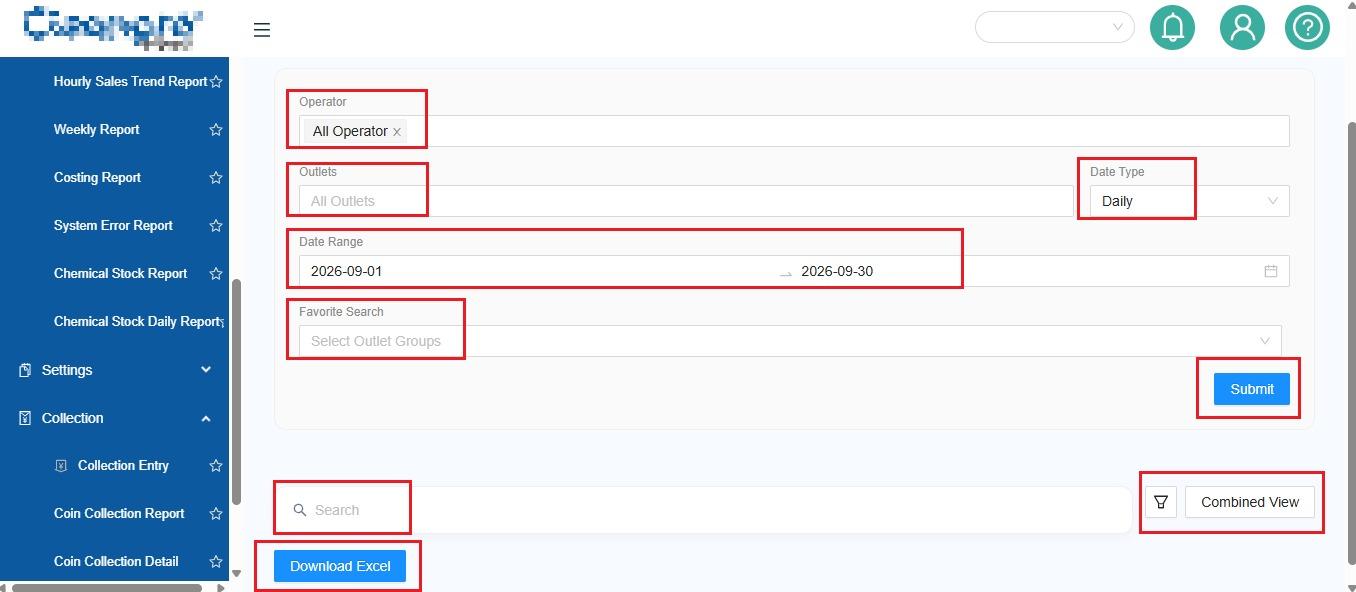
After selecting all filters, click Submit.
The report will be generated based on your selected:
Operator + Outlet + Date Type + Date Range + View Type
📈 Understanding the Report
📈 Total Variance
Shows the variance information for the collection record.
↔️ Difference
Shows the difference between the relevant collection values.
ℹ️ Variance Information
Use the information icon to understand what positive and negative variance represents.
🔧 Customize the Report
🔧 Column Filter
Click Column Filter to select which columns you want to display.
This allows you to keep only the information you need.
⭐ Add Favourite
Click Add Favourite to save your preferred report settings for easier access later.
Favourite settings can also be synced with the Collection report.
📥 Download Excel
Click Download Excel to download the report.
The Excel file includes:
📋 All
→ Combined data from the selected outlets.
🏪 Individual Outlet Sheets
→ Separate data for each outlet.
Example
📊 Excel Report
├── 📋 All
├── 🏪 Outlet A
├── 🏪 Outlet B
└── 🏪 Outlet C
📝 Example
Check September Collection for Multiple Outlets
👤 Operator: All Operator
🏪 Outlet: Outlet A + Outlet B
📅 Date Type: Daily
🗓️ Date Range: 1–30 September 2026
👀 View Type: Combined View
Process
Select Filters → 📊 Submit → 📈 Review Report → 🔍 Check Variance → 📥 Download Excel
💡 Quick Tips
- Use Daily when you need a day-by-day collection view.
- Use Monthly when you need a month-by-month view.
- Use By Outlet to review outlets separately.
- Use Combined View to review multiple outlets together.
- Click Submit after changing the Date Type.
- Use Column Filter to simplify the report.
- Use Add Favourite for frequently used report settings.
- Use Download Excel when you need the data for further analysis.