Coin Collection by outlet v2
e71XEHPw4SteBeRe-image-1788771162595.png5hbJPUQJAzxPFZdP-image-1788771162591.pngTfHq0SKkIIqE1PRx-image-1788771162584.png

Filter


Function

🪙 Purpose

TheUse followingCoin filtersCollection areby availableOutlet forv2 generatingto theview report:coin collection records by operator, outlet, and date.

    You

    can

    view each outlet separately or combine multiple outlets into one report.


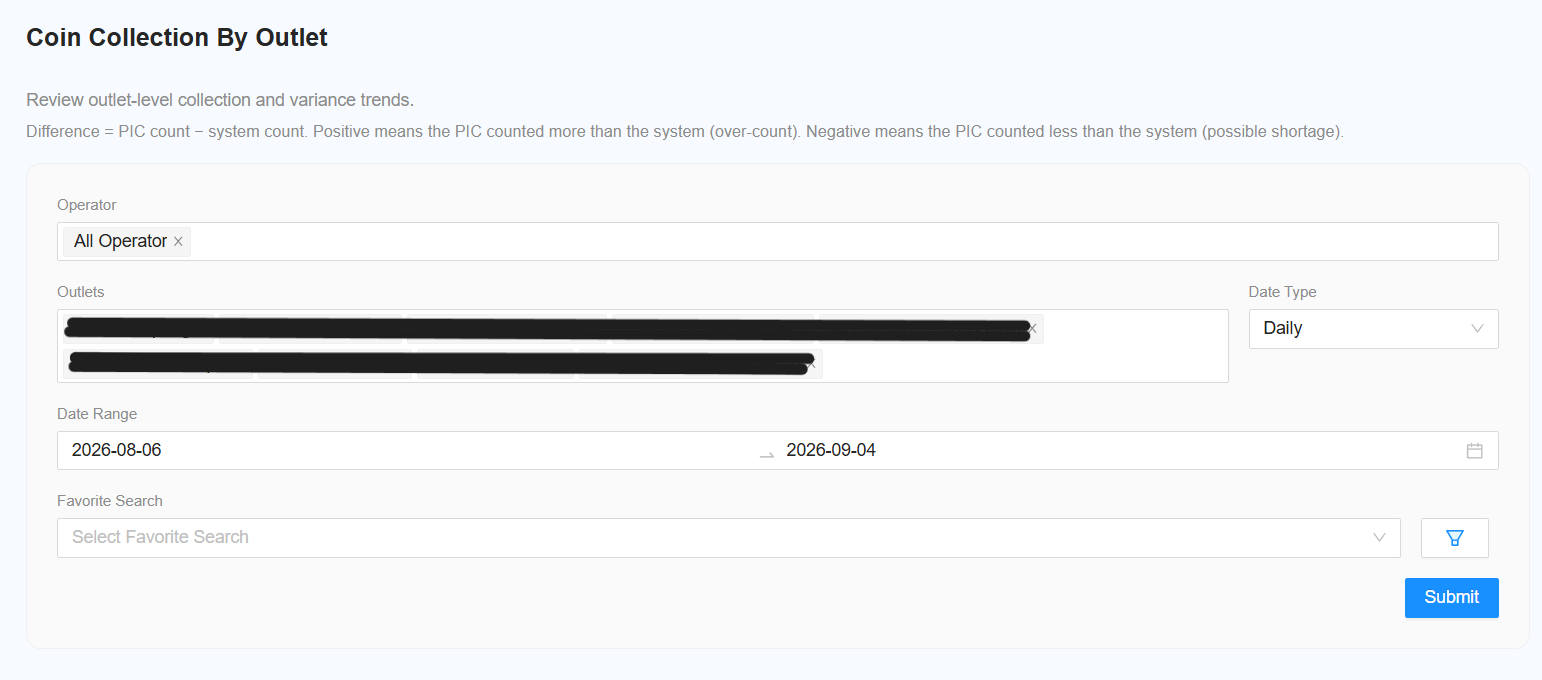
    🔎 Step 1: Select Operator

      Select the required operator. Select All Operator to include all operators.

      Select Outlet

        Select the required outlet. Select All Outlet to include all outlets.

        Select Date Type

          Select the dateoperator type:you want to check.

            DailySpecific Operator → View one operator. MonthlyAll Operator → Include all operators.

            🏪 Step 2: Select Outlet

            Select the outlet you want to check.

            • Specific Outlet → View one outlet.
            • All Outlet → Include all outlets.

            📅 Step 3: Select Date Type

            Choose how you want the report to be displayed.

            📆 Daily

            View the collection by individual day.

            Example: 1–30 September 2026

            🗓️ Monthly

            View the collection by month.

            Example: January–September 2026

            💡 Tip: After changing the Date Type, click Submit to refresh the report.


            🗓️ Step 4: Select Date Range

              Select the required date range based on the selected dateDate type.

              Type.

              [NEW]Daily: Select the required start and end date.

              Monthly: Select the required months.


              👀 Step 5: Select View Type (Optional)

                Choose how theyou report should be displayed:

                  By Outlet — displaywant the report separatelyto forbe displayed.

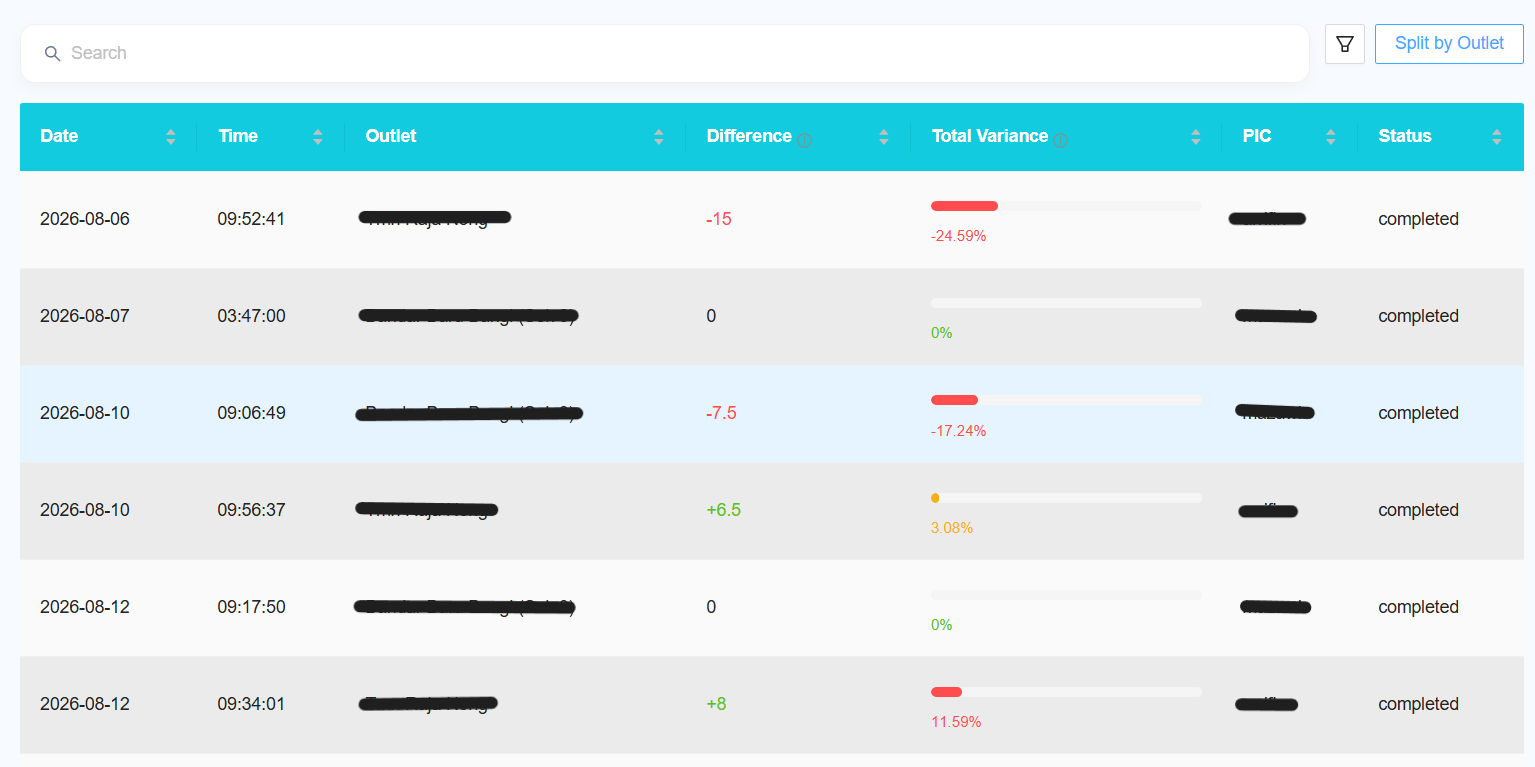
                  🏪 By Outlet

                  View each outlet.

                  selected outlet separately.

                  Outlet A → Report A
                  Outlet B → Report B
                  Outlet C → Report C

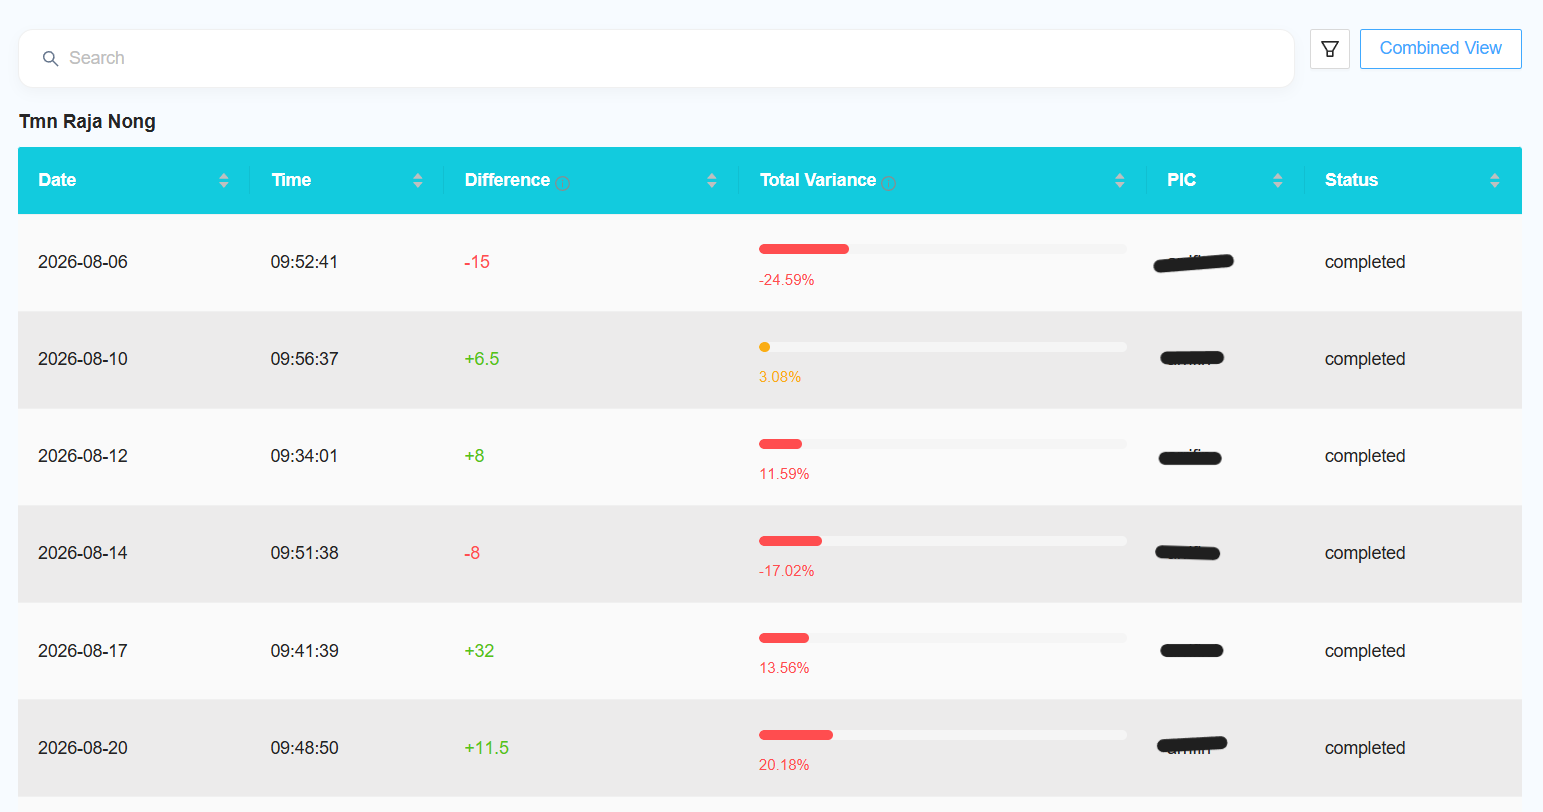
                  🔗 Combined View

                  — combine

                  Combine the data from all selected outlets into a singleone report.

                  Outlet

                  A +

                  ReportingOutlet Changes

                  B + Outlet C
                  ↓
                  📊 One Combined Report

                  🤔 Which One Should I Use?

                  Need to check each outlet separately?
                  ➡️ Choose By Outlet

                  Want to review multiple outlets together?
                  ➡️ Choose Combined View


                  📊 Step 6: Generate the Report

                  After selecting all filters, click Submit.

                  The followingreport changeswill be generated based on your selected:

                  Operator + Outlet + Date Type + Date Range + View Type


                  📈 Understanding the Report

                  📈 Total Variance

                  Shows the variance information for the collection record.

                  ↔️ Difference

                  Shows the difference between the relevant collection values.

                  ℹ️ Variance Information

                  Use the information icon to understand what positive and improvementsnegative havevariance beenrepresents.

                  made

                  🔧 Customize the Report

                  🔧 Column Filter

                  Click Column Filter to select which columns you want to display.

                  This allows you to keep only the report:information you need.

                    [NEW]

                    ⭐ Add Favourite

                      Click

                      Add the optionFavourite to marksave theyour preferred report assettings afor favourite.easier access later.

                      Favourite settings can also be synced with the Collection report.


                      📥

                      Download Excel

                      Click [NEW]Download Change PctExcel to Total Variance

                        Rename the Pct column to Total Variance.

                        [NEW] Display Difference

                          Add a Difference column todownload the report.

                          The

                          Excel file includes:

                          [NEW]📋 AddAll
                          → ColumnCombined Filter

                          data
                            Allow users to select which columns are displayed infrom the report.selected Follow the same column filter functionality used in other browsable reports. outlets.

                            [NEW]🏪 VarianceIndividual ExplanationOutlet Sheets


                            →
                              Separate Provide an explanation of what positive and negative variance represents.

                              [NEW] Excel Download Improvement

                                Correct the header row in the downloaded Excel report. Add one All sheet containing the combined data. Add a separate sheetdata for each outlet.

                                Example

                                📊

                                Excel Report

                                ├── 📋 All
                                ├── 🏪 Outlet A
                                ├── 🏪 Outlet B
                                └── 🏪 Outlet C


                                📝 Example

                                Check September Collection for Multiple Outlets

                                [NEW]👤 Operator: All Operator
                                🏪 Outlet: Outlet A + Outlet B
                                📅 Date TypeType: UpdateDaily
                                🗓️ Date Range: 1–30 September 2026
                                👀 View Type: Combined View

                                Process

                                Select Filters → 📊 Submit → 📈 Review Report → 🔍 Check Variance → 📥 Download Excel

                                💡 Quick Tips

                                • Use Daily when you need a day-by-day collection view.
                                • WhenUse Monthly when you need a month-by-month view.
                                • Use By Outlet to review outlets separately.
                                • Use Combined View to review multiple outlets together.
                                • Click Submit after changing the dateDate typeType.
                                • Use betweenColumn MonthlyFilter andto Daily, updatesimplify the tablereport.
                                • Use formatAdd accordingly.
                                Favourite Thefor frequently used report datasettings.Use willDownload onlyExcel bewhen refreshedyou after clicking Submit.

                                [NEW] Split by Outlet

                                  Add a Split by Outlet option, similar toneed the Billdata Collectionfor report.further analysis.

                                  [NEW] Favourite Sync

                                    Allow favourite settings to be shared/synced with the Collection report.

                                    [NEW] Tooltip Behaviour

                                      Fix the tooltip behaviour when hovering over the information icon. The ascending and descending sort tooltips should not appear at the same time.